Driving Dashboard Adoption through Business Process Analysis

Effective dashboard design is fundamental to ensuring that business users adopt reports, and move the organisation towards becoming truly data-driven. But what makes a dashboard effective?
There are numerous examples online showcasing what makes a visually appealing dashboard. Key elements include effective use of colour, choosing the right visualisations for the data, clear and well-formatted titles, and avoiding pie charts! These factors are crucial as they help users navigate and trust the reports being displayed. However, our experience shows that a truly effective dashboard—one that is widely adopted and supports decision-making—must be grounded in a deep understanding of business processes. Without this foundation, dashboards often present a lot of information but offer little insight, leaving users to piece together disparate elements to make sense of the data being displayed.
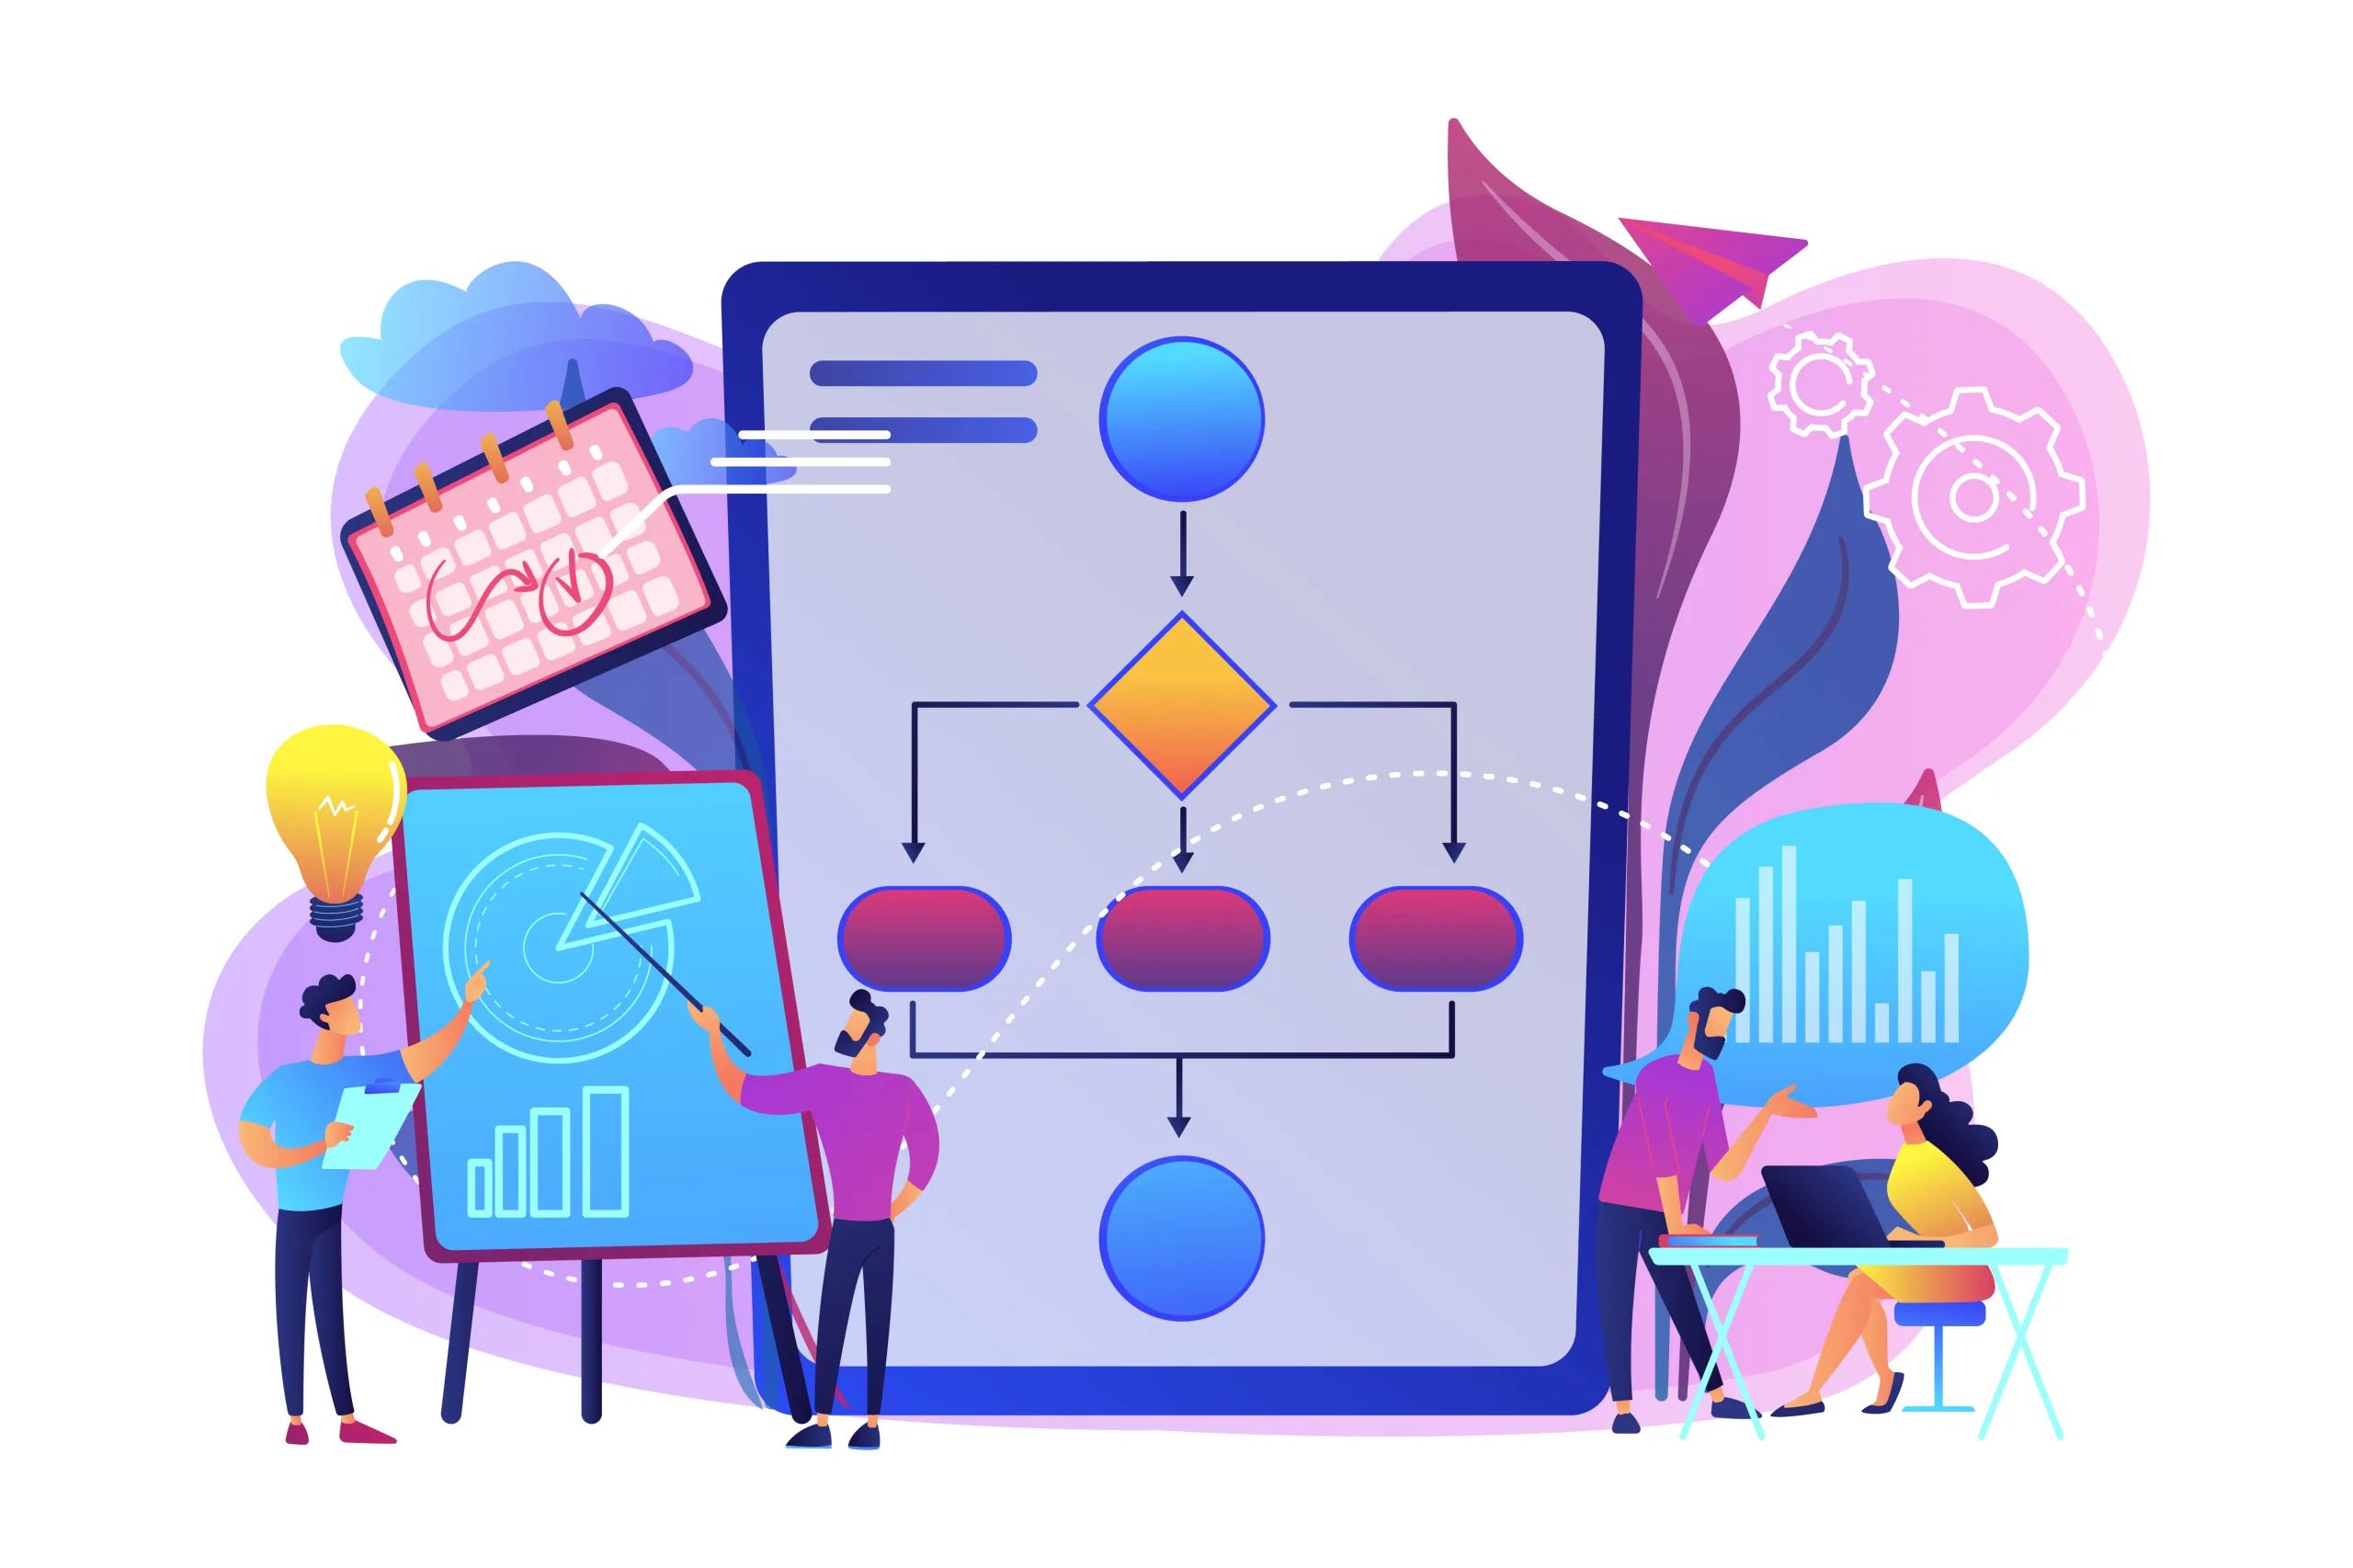
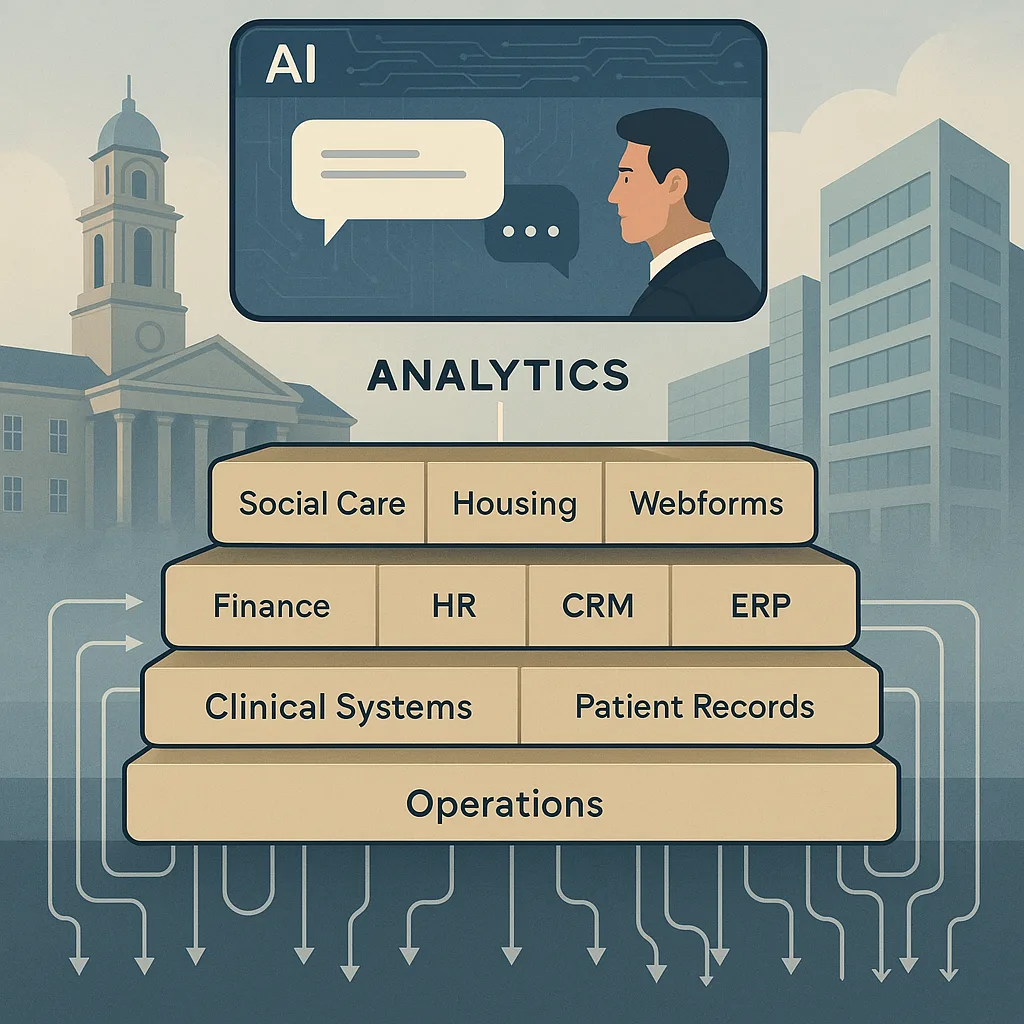
At itelligent-i, our Analytics Consultants go beyond the role of traditional data analysts. Their work is multi-faceted, beginning with a deep curiosity for business analysis. They strive to understand the complete process of each council function, identifying critical decision points, dependencies, and responsibilities. This understanding allows them to align the captured data with these processes, highlighting the elements most crucial to decision-makers.
People often talk about dashboards ‘telling a story’, which essentially means that the users of that dashboard can see their business end-to-end, and the key twists and turns of the plot are clearly highlighted as they navigate the report. Stories also have a conclusion and we like to think of this as the ‘so what’ test! Drawing out the highlights, exceptions and main areas of focus at a glance for strategic decision makers, with the opportunity to drill further into the detail for operational staff.
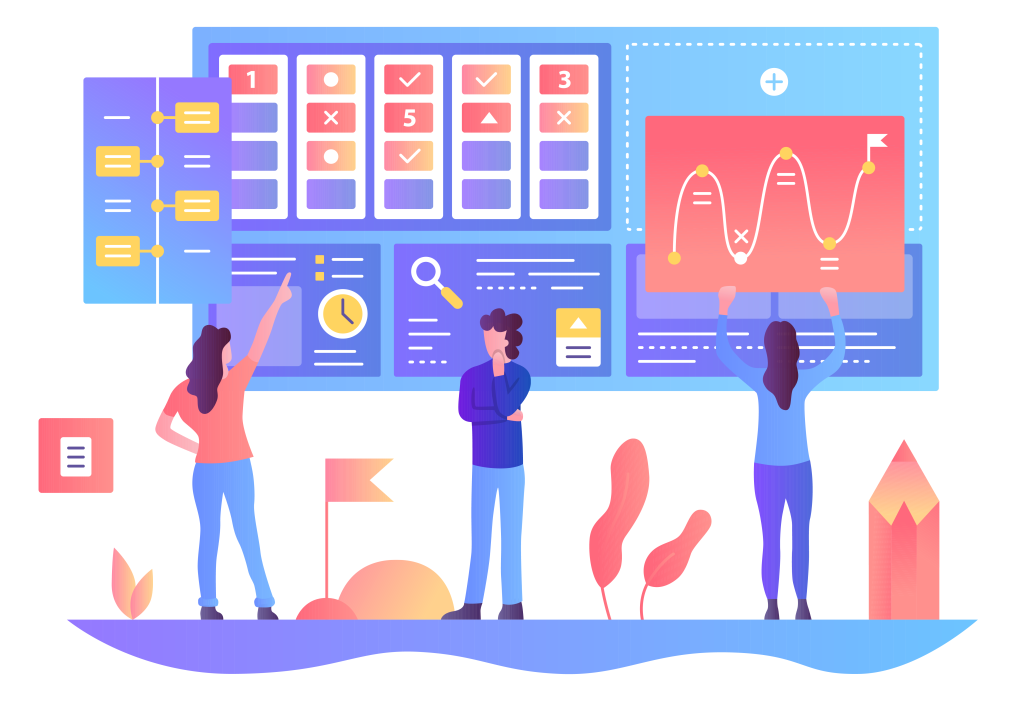
It’s easy to get carried away when designing dashboards, focusing more on aesthetics than functionality. This often leads to surprise when the dashboard isn’t adopted by users. Report and dashboard users have demanding jobs, so accessing meaningful insights should seamlessly integrate into their day-to-day activities, rather than becoming an additional, time-consuming task.
itelligent-i analytics accelerators adhere to the following key principles:
- Understand User Requirements: Identifying the business questions that can be answered through insightful data analysis
- Aligned with Business Processes: Extracting essential insights throughout the process
- Consistent Design: Maintaining a uniform look and feel so users can easily navigate new reports without needing to relearn features and functionality
- Clear and Professional Presentation: Ensuring reports are uncluttered, polished, and professional, fostering user trust in the insights provided
While technical data modelling and analysis skills are essential, what truly sets us apart at itelligent-i is our inquisitive understanding of business processes and alignment with local priorities. This approach distinguishes itelligent-i Analytics Consultants from simple dashboard developers, ensuring that our solutions are not only technically sound but also deeply relevant and impactful for our clients.
If you’re organisation is lacking in effective insights, that support data-driven decision making, get in touch to see some examples of itelligent-i’s analytics accelerators.